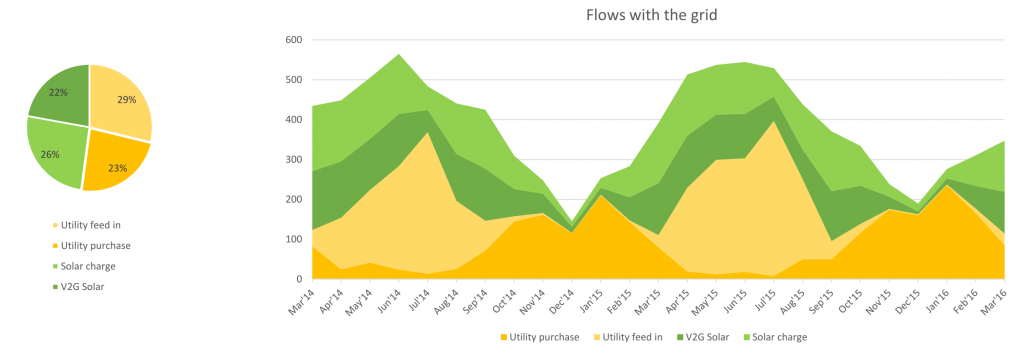
Find below some more detailed graphics with the most relevant parameters displayed. The main observations, still in validation process, are:
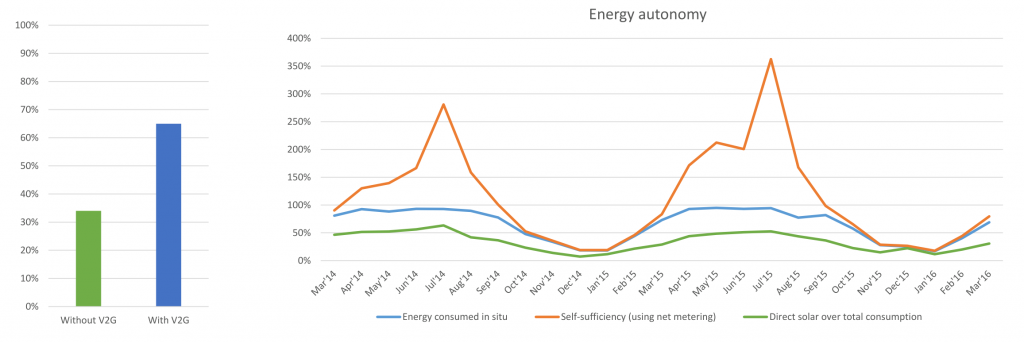
- The household increased its energy independence or, zero Emission energy autonomy, by 31% (from 34 to 65% with V2G);
- Solid decline in energy exchange with the electricity network 45% less compared to situation without V2G;
- Storage size efficiency reaches 93% with 10 kWh storage capacity, this is close to a maximum storage level, more storage capacity contributes little extra;
- Operational energy losses in storage in DC batteries, and re-conversion when consuming the energy about 20%.
- Capacity of the battery and the degradation of this after in 2 year time is quite limited (ca. 6-7%).
Monthly energy balance
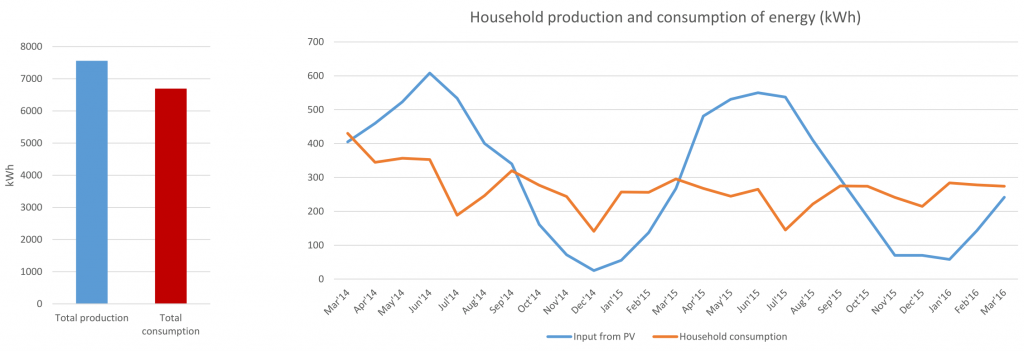
As expected, Amsterdam V2G generates electricity in a variable way along the year. In contrast the household consumption stays more constant (although you can notice the holiday periods, this is a real living lab!). In consequence, between March and Spetember the production of energy overpasses the consumption. Note also how in September and March the amount of energy produced match closely the consumption; these are, so to speak, “hinge months” under the energy balance perspective.
Energy autonomy
Just 34% of the energy consumed by the household comes directly from the photovoltaic installation. Without the EV, the rest of the energy would be injected into the grid, or taken from it. The presence of the battery, however, allows for an energy buffer between the production and consumption of energy, bridging the gap between both. In consequence, the proportion of energy consumed either directly from the sun or indirectly from the EV amounts to 65%.
Thus, we observe that the inclusion of the EV improves energy autonomy by 31%. The presence of the grid is not so necessary, and the household can cover better its energy requirements.
Energy flows
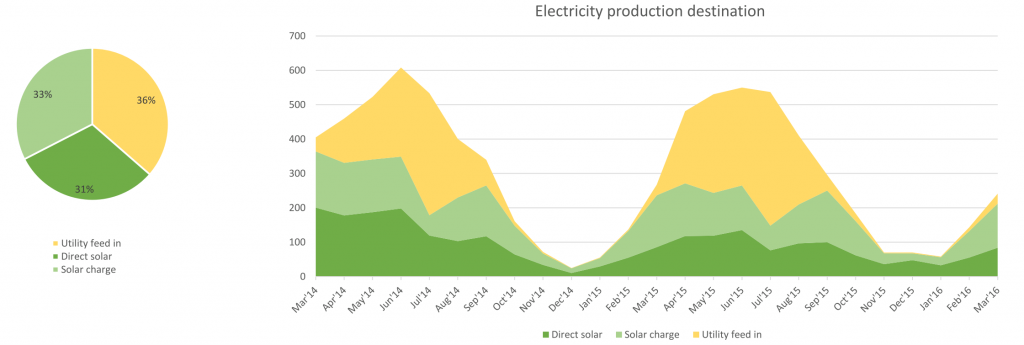
As commented above, approximately one third of the energy produced by the PV installation is directly consumed by the household. Another thrid is injected into the EV, and the remaining third is injected into the grid. There are important seasonal variations, however: note the excess of energy production during summer months.
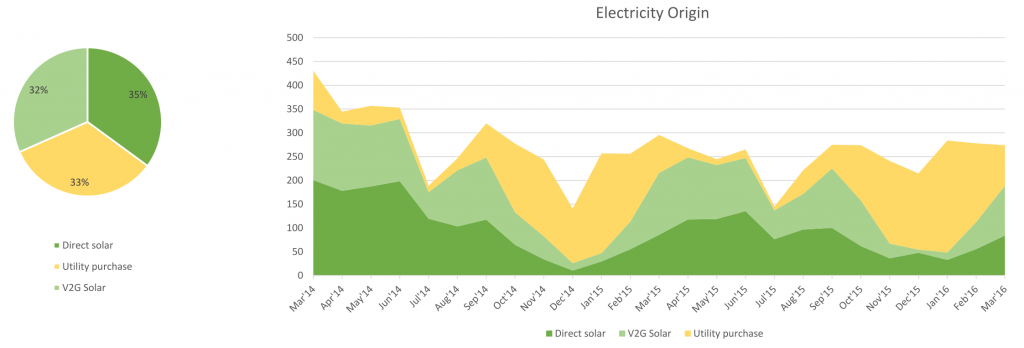
The energy consumed by the household can come from three different souces: directly from the sun, purchased from the grid, or from the EV battery. As seen below, on a yearly basis the proportion of these three sources is fairly balanced, but there are significant seasonal differences. Note how during winter the proportion of “utility purchase” increases, and how important is the presence of the EV battery during the summer months.
Battery use
About this last point, it is worth to consider the amount of energy exchanged with the grid and with the battery. The figure below shows how the proportion of energy injected or withdrawn from the grid (yellow) and from the battery (green). All the energy exchanged with the battery shall be exchanged witht the grid if the EV were not present, therefore the graph provides an idea of the energy exchange that the presence of the battery spares from the grid.
According to this data, the presence of the EV battery almos halves the energy exchange with the grid. This can be a great way to increase grid stability in the near future, when widespread of local renwable production put in risk the capacity of the grid.
We also observe that the biggest advantages for grid use reduction are reached in Septermber and March, precisely the months when the volumen of production and consumption of energy is more or less equal, and the batteries are used the most, loading during daytime and discharging during the evening.
Another question is wether the EV battery is big enough to reap the benefits of the PV installation.
Our calculations suggest that with a 7kWh battery, 93% of the energy that is produced by PV (and could be used by the household) is already leveraged
Last, there is the question about the battery degradation during these last two years, during which the batteries have experienced around five hundred cycles of charge and discharge. First of all, the capacity of the battery remains more or less constant: it loads completely with 7 kWh, and discharges 6,5 kWh. This means 0,5 kWh of electricity are lost in the conversion.
The ratio of incoming energy and outcoming energy is not reliable during winter months, due to the scarce use of the battery and its maintenance operations. During summer, the data is more reliable, and yield a more or less constant efficiency around 80%. Considering only the months of September and March, the ones where the battery is used the most, the efficiency of the battery experiences an slight, constant decrease in efficiency, from 90% to 82%.


